
The Imports the U.S. Relies On Most From 140 Nations, From Albania to Zimbabwe
President Trump’s on-and-off tariffs have created deep uncertainty about the cost of imported goods — and it’s not always clear what goods will be most affected with any given country.
The largest U.S. imports from many countries are oil and gas, electronics, cars and pharmaceuticals. But there’s another way to look at what Americans import: trying to measure a country’s distinct contribution to the U.S.’s total needs.

For example, China’s largest exports to the U.S. — by dollar value — are electronics. But the U.S. also imports large quantities of electronics from elsewhere. Nearly 100 percent of imported baby carriages, however, come from China.
Switzerland, meanwhile, is responsible for nearly all of America’s imported precious metal watches. Ethiopia, on the other hand, sends the U.S. around 2 percent of its imported knit babies’ clothes — but that’s a larger share than for any other item it exports to the U.S.
The table below shows the item the U.S. relies on most from each of 140 trading partners. (We took out items that the U.S. also exports in large quantities, such as petroleum.)
What the U.S. is most reliant on from each country
| COUNTRY | ITEM | Pct. of U.S. imports from here |
|
|---|---|---|---|
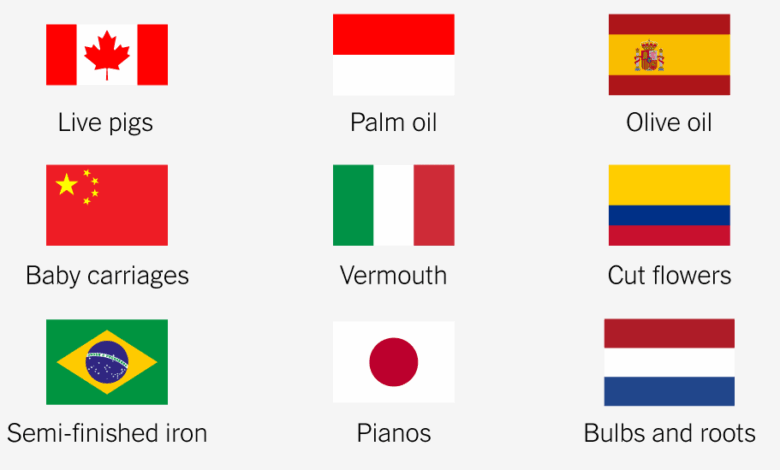
| Canada | Live pigs | >99% | |
| Peru | Calcium phosphates | >99% | |
| South Africa | Chromium ore | 98% | |
| Switzerland | Precious metal watches | 98% | |
| China | Baby carriages | 97% | |
| Mexico | Self-propelled rail transport | 94% | |
| Portugal | Natural cork articles | 93% | |
| India | Synthetic reconstructed jewelry stones | 89% | |
| Italy | Vermouth | 86% | |
| Indonesia | Palm oil | 85% | |
| Madagascar | Vanilla | 80% | |
| Turkey | Retail artificial filament yarn | 79% | |
| Brazil | Semi-finished iron | 76% | |
| Vietnam | Coconuts, brazil nuts, and cashews | 75% | |
| Australia | Sheep and goat meat | 74% | |
| New Zealand | Misc. animal fats | 73% | |
| Gabon | Manganese ore | 71% | |
| Chile | Refined copper | 71% | |
| Netherlands | Bulbs and roots | 70% | |
| Spain | Olive oil | 62% | |
| Taiwan | Tapioca | 62% | |
| Argentina | Groundnut oil | 60% | |
| Colombia | Cut flowers | 60% | |
| Bolivia | Tungsten ore | 59% | |
| Dominican Republic | Rolled tobacco | 59% | |
| Cote d’Ivoire | Cocoa paste | 59% | |
| Germany | Felt machinery | 58% | |
| Finland | Cobalt oxides and hydroxides | 56% | |
| Japan | Pianos | 52% | |
| Israel | Phosphatic fertilizers | 50% | |
| Philippines | Coconut oil | 50% | |
| France | Insect resins | 50% | |
| Thailand | Sugar preserved foods | 47% | |
| Malaysia | Rubber apparel | 46% | |
| Ireland | Sulfonamides | 45% | |
| Pakistan | Light mixed woven cotton | 43% | |
| Singapore | Glass with edge workings | 39% | |
| Guatemala | Bananas | 38% | |
| Ecuador | Cocoa beans | 38% | |
| South Korea | Rubber inner tubes | 33% | |
| Jamaica | Aluminum ore | 33% | |
| Bangladesh | Non-knit babies’ garments | 31% | |
| Austria | Handguns | 29% | |
| United Kingdom | Antiques | 28% | |
| Cambodia | Gum coated textile fabric | 25% | |
| Nicaragua | Rolled tobacco | 24% | |
| Guyana | Aluminum ore | 24% | |
| Ukraine | Seed oils | 24% | |
| Belgium | Flax woven fabric | 22% | |
| Bahrain | Stranded aluminum wire | 22% | |
| Sri Lanka | Coconut and other vegetable fibers | 21% | |
| Morocco | Barium sulphate | 20% | |
| Romania | Steel ingots | 19% | |
| Norway | Carbides | 19% | |
| Sweden | Stainless steel ingots | 17% | |
| Costa Rica | Bananas | 16% | |
| Honduras | Molasses | 16% | |
| Paraguay | Wood charcoal | 16% | |
| Denmark | Casein | 15% | |
| Tunisia | Pure olive oil | 15% | |
| Russia | Phosphatic fertilizers | 15% | |
| Fiji | Water | 15% | |
| Hong Kong | Pearls | 13% | |
| Nepal | Knotted carpets | 13% | |
| Poland | Processed mushrooms | 12% | |
| Lebanon | Phosphatic fertilizers | 12% | |
| Croatia | Handguns | 12% | |
| Bulgaria | Non-retail combed wool yarn | 12% | |
| Laos | Barium sulphate | 12% | |
| Mozambique | Titanium ore | 11% | |
| Ghana | Cocoa beans | 11% | |
| Bahamas | Gravel and crushed stone | 10% | |
| Greece | Dried, salted, smoked or brined fish | 10% | |
| Jordan | Knit men’s coats | 10% | |
| Czech Republic | Rolling machines | 10% | |
| El Salvador | Molasses | 10% | |
| Egypt | Spice seeds | 10% | |
| United Arab Emirates | Raw aluminum | 9% | |
| Uganda | Vanilla | 9% | |
| Nigeria | Raw lead | 9% | |
| Uruguay | Bovine, sheep, and goat fat | 9% | |
| Latvia | Book-binding machines | 9% | |
| Kazakhstan | Ironmaking alloys | 8% | |
| Cameroon | Cocoa paste | 8% | |
| Lithuania | Wheat gluten | 8% | |
| Oman | Metal office supplies | 8% | |
| Hungary | Seed oils | 7% | |
| Belize | Molasses | 7% | |
| Faroe Islands | Non-fillet fresh fish | 6% | |
| Qatar | Pearls | 6% | |
| Myanmar | Misc. knit clothing accessories | 5% | |
| Zambia | Precious stones | 5% | |
| Slovenia | Packaged medications | 5% | |
| Senegal | Titanium ore | 5% | |
| Algeria | Cement | 4% | |
| Haiti | Knit T-shirts | 4% | |
| Kenya | Titanium ore | 4% | |
| Liechtenstein | Iron nails | 4% | |
| Georgia | Ironmaking alloys | 4% | |
| Liberia | Rubber | 4% | |
| Serbia | Rubber inner tubes | 4% | |
| Iceland | Fish fillets | 4% | |
| Democratic Republic of the Congo | Refined copper | 3% | |
| Botswana | Diamonds | 3% | |
| Chad | Insect resins | 3% | |
| Zimbabwe | Leather further prepared after tanning or crusting | 3% | |
| Luxembourg | Polyamide fabric | 3% | |
| Panama | Non-fillet fresh fish | 3% | |
| Albania | Ironmaking alloys | 3% | |
| Estonia | Fishing and hunting equipment | 2% | |
| Ethiopia | Knit babies’ garments | 2% | |
| Namibia | Wood charcoal | 2% | |
| Venezuela | Processed crustaceans | 2% | |
| Slovakia | Rubber tires | 2% | |
| Lesotho | Knit men’s shirts | 2% | |
| Tanzania | Precious stones | 2% | |
| Papua New Guinea | Vanilla | 1% | |
| Mauritius | Processed fish | 1% | |
| Saudi Arabia | Iron nails | 1% | |
| Moldova | Wine | <1% | |
| Suriname | Non-fillet fresh fish | <1% | |
| Angola | Pig iron | <1% | |
| Armenia | Diamonds | <1% | |
| Trinidad and Tobago | Non-fillet fresh fish | <1% | |
| Macau | Knitted hats | <1% | |
| North Macedonia | Curbstones | <1% | |
| Togo | Fake hair | <1% | |
| Bosnia and Herzegovina | Non-knit women’s coats | <1% | |
| Republic of the Congo | Antiques | <1% | |
| Azerbaijan | Ironmaking alloys | <1% | |
| Iraq | Antiques | <1% | |
| Libya | Misc. vegetable products | <1% | |
| Cyprus | Olive oil | <1% | |
| Kuwait | Ironmaking alloys | <1% | |
| Malta | Air conditioners | <1% | |
| British Virgin Islands | Diamonds | <1% | |
| Brunei | Knit T-shirts | <1% | |
| Cayman Islands | Phones | <1% | |
| Equatorial Guinea | Knitted hats | <1% | |
| Sint Maarten | Hard liquor | <1% |
Curious where the U.S. imports a particular item from? You can look it up below.
Searchable table
| Computers $138.5 billion in imports | ||
| Mexico | 35% | |
| China | 26% | |
| Taiwan | 19% | |
| Vietnam | 11% | |
| Thailand | 5% | |
| Phones $119 billion | ||
| China | 42% | |
| Vietnam | 17% | |
| Mexico | 9% | |
| India | 7% | |
| Thailand | 7% | |
| Packaged medications $100.4 billion | ||
| Ireland | 16% | |
| Switzerland | 12% | |
| India | 12% | |
| Italy | 7% | |
| China | 6% | |
About the data
We analyzed U.S. International Trade Commission data on goods imported for consumption in 2024. We used product descriptions from the Observatory of Economic Complexity to label the goods, and edited these descriptions lightly.
We grouped goods using the first four digits of their code in the Harmonized Tariff Schedule, which lists categories of products.
We excluded goods that are widely produced in the U.S., using export data to remove goods where the U.S. exports at least 25 percent of what it imports by value.
We included only trading partners that export at least $50 million of goods each year to the U.S.